The term "Compensation" in flow cytometers refers to the process of correcting fluorescence spill over. The compensation matrix ensures that the fluorescence emitted is detected in a particular detector which is from the fluorescence being measured. As we all know that most of the fluorescence molecules have broad emission range. if more than one one fluorescence is selected, their emission spectra may overlap. To correct this spectral overlap in cytometry data, a mathematical matrix called compensation is used.
The Intention of this article is to teach you the compensation from basic theory to practical.
This example for FITC and PE fluorescence molecules shows that, Some of the FITC fluorescence is being detected in PE Detector. and Some of the PE fluorescence is being detected in FITC Detectors. Task here is to make sure that in cytometry data, FITC is in FITC detector only and PE is in PE Detector only.
(FITC + PE Overlap) - (PE Overlap) = accurate FITC
(PE + FITC Overlap) - (FITC Overlap) = accurate PE
 |
| Source: BD Spectrum Viewer |
Experiment: Analysis of two-color flow cytometry data in BD Accuri C6 Flow Cytometer. FITC and PE. And applying the Compensation.
Sample Tubes Required:
1) Unstained Cells2) Cells with FITC
3) Cells with PE
4) Cells with both FITC and PE
Flow Cytometer: BD Accuri C6
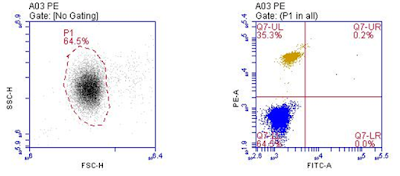
1) Data Plots: SSC vs FSC, FITC vs PE. (If you want, you can draw another plot to identify the singlets, that is FSC-Height vs FSC-Area). For all tubes, make sure you record sufficient and equal number of cells. It would be better if you record 20,000 events for each tube.
3) Load the tube FITC cells and record the data
4) Load the tube with PE Cells and record the data
Analyze the fluorescence data for FITC and PE. FITC is falling in PE Detector and some of the PE cells very few are falling FITC Detector. Now, Compensation must be applied.. Compensation values for these two fluorescence in Accuri C6 are shown in the below compensation matrix.

(FL1 is for FITC and FL2 is for PE). After applying these values spill over compensation values. You will see the data like shown below.


After compensation, FITC is in FITC detector and PE is PE Detector.
5) Finally load the tube which has both FITC and PE Cells and record the data
(Here there are four possibilities, 1: cell has only FITC, 2: cell has only PE and 3: Cell has both FITC and PE, 4: Cell has no fluorescence.. These possibilities must be considered when analyzing more than one fluorescence in flow cytometry). Since, compensation has been applied above for FITC and PE fluorescence, the sample tube which has both FITC and PE cells will show data like shown below.
In today's flow cytometers, you can analyze up to 15-20 colors at a time. which is typically called a multi-color flow cytometry..
For multi-color flow cytometry, you need to have good understanding of the instrument sensitivity, performance, understanding fluorescence excitation and emission, antibody titration, fluorochrome choice, required controls and many more parameters should be considered.


ReplyDeleteLaboratory Incubator