
2. Thin Layer Chromatography (TLC)

Thin Layer Chromatography principle is similar to paper chromatography. The sample is spotted at one end of a coated glass plate, with the slurry of the adsorbents. Usually, Silica gel or Sodium Acetate. Using solvent systems develops the spotted plate and the spots are deducted as in paper chromatography. 
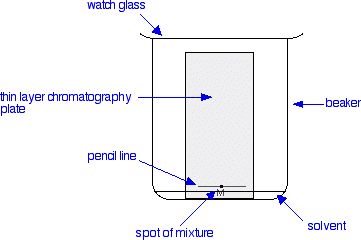


Image result for schematic diagram thin layer chromatography
Image Source: Chemguide

The separation of substances by TLC is faster than by the paper chromatographic method. TLC is commonly used to separate components in complex mixtures and the results obtained are more reproducible. 

Using TLC method, the substances that can be separated are Amino Acids, Sugars and Lipids. 

Comments

Popular posts from this blog

Statistics in Flow Cytometry Data and "MFI" values

                                 The speed of the flow cytometry offers wide range of data points and data plots. Due to its sensitivity and versatility, it has been used extensively. Flow cytometer can detect up to 1000s of cells per second.. But, it should be noted that the flow cytometry also involves the statistics, its significance, calculating the fluorescence intensity..                Statistics in flow cytometry involves, total number of data points acquired, percentage population, most importantly mean and median fluorescence intensity, and others. Most of us get confused about the term "MFI", whether it means mean fluorescence intensity or median fluorescence intensity.. Truth is, both.. It means it can be described as either mean or median fluorescence intensity. Some researchers use Mean for MFI and some use Median for MFI values.  (Keep...

Protocol: Sample preparation for Cell Cycle Analysis by Flow Cytometry

Protocol:  Preparation of Samples for Cell Cycle Analysis by Flow Cytometry: 1) Suspend approximately million cells (10^6) in 1mL of phosphate-buffered saline solution (1x). And with the help of pipette, gently aspirate about 7-8 times, to make the single cell suspension.  2) Take a centrifuge tube and add 4mL of 70% ethanol. (70% ethanol should be one ice before using). and add 1mL of cells in PBS to this tube. Keep the tubes on ice for minimum 2 hours at 4℃.. This step will fix the cells.  ( cells can kept at 4 ℃ for a week).  3) Centrifuge the ethanol fixed cells for 5 minutes at 300g. Carefully take out the supernatant. Do not disturb the pellet.  4) Add 5mL of cold 1x PBS to this pellet and suspend the cells using pipette.  5) Centrifuge the tubes at 300g for 5 minutes. and discard the supernatant. Again do not disturb the pellet.  6) if required, step 5 can be repeated for one more time.  7) Add 1mL of Propidium Iodide (PI...

Fluorescence Spectrum Viewers Tool.

                Spectra Viewers are the fluorochrome tools which help in understanding the wavelength ranges of excitation and emission of fluorochromes.. These tools are very helpful in determining specific laser, detectors and range of fluorescence spectra. When Multi-Color Flow Cytometry is the experiment, then these must be used to analyze emission spectrum, fluorescence spill over and compensation values. How these tools help.. First, Lets consider a simple example of analyzing the spectrum for Green Fluorescence Protein (GFP) and you want to know the excitation wavelength and emission wavelength range for GFP. By knowledge, you know that GFP will excite with 488nm Blue laser and emits the green fluorescence at apporximately 510nm.. Now, just open a spectrum viewer and select the GFP as shown below. Now, you have analyzed GFP fluorescence and received the knowledge that It excites with 488nm Blue Laser and emission maximum is...