Basics and Principles:
The term "Flow Cytometer" refers to an instrument which is capable of measuring various properties of cells which are in motion.
The term "Flow Cytometer" refers to an instrument which is capable of measuring various properties of cells which are in motion.
Flow = Motion, Cyto = Cell, Meter = Measurement.
Flow Cytometry is a biomedical technique which is used to analyze, count and sort different populations of cells from a heterogeneous population of cells. This instrument is used to measure the biophysical and biochemical properties of cells or particles under study by understanding their light scattering especially fluorescence scattering properties. Instrument allows the measurement of thousands of cells per second, which makes it a quantitative instrument capable of quantifying the fluorescence intensity.
It has been extensively used in immunological studies, disease monitoring, biomedical studies, identification and characterization of microorganisms, identification of variety of cellular markers, bio-marker detection, the list goes on.. and it has been very helpful instrument in multi-color flow cytometry where multiple fluorescence molecules on thousands of cells per second are analyzed in immunological studies and disease monitoring.
The technique involves the preparation of single cell suspension from a cell culture plate or tissue section, staining these cells with fluorescent molecules and then analyzed on the cytometer.
Principle:
The principle of flow cytometer is, the suspension of single cells from a cell culture is passed through a flow chamber, where cells are aligned in a single cell fashion with the help of sheath fluid which hydrodynamically focuses these cells allowing them to pass through a narrow orifice (or nozzle) one cell at a time. The cells will then hit the laser beam one by one and scatter light in all directions. The scattered light are detected and collected by the detectors placed infront of the laser beam. These detectors will convert the photon signal into electronic signal which is recorded and analyzed by a specialized flow cytometry software.
(Note: The laser beam is installed just below the orifice..
There are detectors, filters and mirrors which scan or filter light signal passing through them)
There are detectors, filters and mirrors which scan or filter light signal passing through them)
 |
| Source: Cytometry Animation on Gfycat |
Components of Flow Cytometer and Measurement of Signal:
Fluidics System:
The suspension of single cells are allowed to pass through a flow chamber, where with the help of sheath fluid, cells are hydrodynamically focused and align them in a single file fashion. These aligned cells then pass through a narrow orifice one at a time..
When cells hit the laser beam, they scatter light in all directions. The light scattered in forward direction called forward scatter and light scattered to side called side scatter are detected by the Forward (FSC) and Side (SSC) detectors. The fluorescence emitted by these cells are detected by the fluorescence detectors.
Figure: Sheath fluid focuses the cell suspension in a single file, cells are passing through a narrow orifice one at a time. Cells hit the laser beam and scatter light. Forward scatter and side scatter (Yellow) are detected. Also fluorescence emitted (Red) are detected by the fluorescence detectors.
Filters are used for filtering and allowing the emitted light to pass through them in a defined wavelength. There are three types of filters: Band Pass (BP), Short Pass (SP) and Long Pass (LP) filters.
Band Pass Filter (BP): filter that transmits the light wavelength within a specified range of wavelengths. For example: 530/40 is a BP filter, which transmits the light between 510nm and 550nm. (that means above 510nm and below 550nm).
Short Pass Filter (SP): filter that transmits the light wavelength below the cut-off wavelength. For Example: 450 is a SP filter, which transmits the light below 450nm and blocks the wavelength above 450nm.
Long Pass Filter (LP): filter that transmits the light wavelength above the cut-off wavelength. For Example: 750 is a LP filter, which transmits the light above 750nm and blocks the wavelength below 750nm.
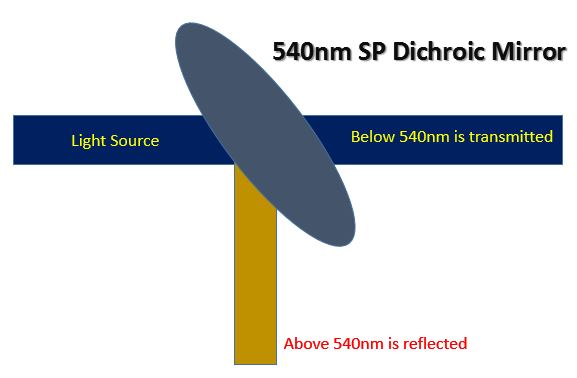
Mirrors such as Dichroic mirrors are used commonly in cytometer. Dichroic mirrors are defined as the mirrors that transmit some of the light in forward direction and reflect some of the light at 90° angle within a cut-off wavelength. There are two types of dichroic mirrors: Dichroic Long Pass Mirror and Dichroic Short Pass Mirror.
Example: 540nm Dichroic Short Pass Mirror, this mirror performs two functions.. One it transmits the light below 540nm in forward direction. Second, it reflects the light above 540nm at 90° angle.
Note: Above example explanation is for Dichroic SP Filter.
 In Dichroic LP Mirror, the mirror transmits the light above cut-off wavelength and reflects the light below cut-off wavelength. For example, 600nm Dichroic LP Mirror, would transmit the light wavelength above 600nm and reflects the light wavelength below 600nm.
Detectors:
In flow cytometer, detectors commonly used are photo diodes and photo-multiplier tubes (PMTs). Most of the today's cytometers have PMTs installed in them. When emitted light travels through a set of filters and mirrors, they are directed to travel to the detectors. These detectors will capture the photo signal and convert them into electronic digital signal in the form of voltage pulse. These signals are then recorded. Light scattered in forward direction is collected by forward scatter detector (FSC) which measures the relative size of the cell, Light scattered to the side is collected by side scatter detector (SSC) which measures the relative granularity of the cell. and fluorescence light is collected by the fluorescence detectors which measure the mean and median fluorescent intensity of the emitted light. Relative height, area and width of the cell in a given heterogeneous population of cells can be measured.
Measurement of Forward and Side Scattered Light:
 When cells or particles are passing through a laser beam, they scatter light in all directions, these scattered light are detected by the forward scatter (FSC) and side scatter (SSC) detectors. FSC measures the relative size of the cell, where as SSC measures the relative granularity of the cell. Based on this concept, cells or particles can be analyzed or separated based on their relative size and granularity.
Example: a very good example for understanding the analysis of cells based on their size and granularity is analyzing blood cells which have different population of cells such as lymphocytes, granulocytes and monocytes.
When prepared blood sample is run in a flow cytometer, granulocytes produce larger population due to their high granularity and large size, so high fsc and high ssc. . Monocytes are large cells, but they are not so granular, they produce high fsc and low ssc. Lymphocytes also produce a separate population, due to their small size and low granularity, they produce low fsc and low ssc. In figure, you can see that, all these cells have produced different population based on their size and granularity.
Fluidics System:
The suspension of single cells are allowed to pass through a flow chamber, where with the help of sheath fluid, cells are hydrodynamically focused and align them in a single file fashion. These aligned cells then pass through a narrow orifice one at a time..
When cells hit the laser beam, they scatter light in all directions. The light scattered in forward direction called forward scatter and light scattered to side called side scatter are detected by the Forward (FSC) and Side (SSC) detectors. The fluorescence emitted by these cells are detected by the fluorescence detectors.
Figure: Sheath fluid focuses the cell suspension in a single file, cells are passing through a narrow orifice one at a time. Cells hit the laser beam and scatter light. Forward scatter and side scatter (Yellow) are detected. Also fluorescence emitted (Red) are detected by the fluorescence detectors.
 |
| Image Source: Abcam |
Lasers, Filters, Mirrors and Detectors:
Lasers in flow cytometer are used as excitation sources. commonly used lasers argon lasers, air-cooled lasers, water-cooled lasers. Almost all flow cytometers have 488nm (Blue) laser as primary excitation source. More than one laser can be installed in a flow cytometer. Some cytometers have up to 10 lasers installed in them. Most commonly used lasers are 488nm (Blue), 561nm (Yellow-Green), 355nm (Ultraviolet), 405nm (Violet), 640nm (Red), 445nm (Blue-Violet) and so on.. These lasers have specific wavelengths assigned to them. When cells emit light, these emitted light should be filtered or scanned for the specific wavelength. For this, filters come in action.Filters are used for filtering and allowing the emitted light to pass through them in a defined wavelength. There are three types of filters: Band Pass (BP), Short Pass (SP) and Long Pass (LP) filters.
Band Pass Filter (BP): filter that transmits the light wavelength within a specified range of wavelengths. For example: 530/40 is a BP filter, which transmits the light between 510nm and 550nm. (that means above 510nm and below 550nm).
 |
| 530/40 BP Filter |
 |
| 450nm SP filter |
 |
| 750nm LP Filter |
Example: 540nm Dichroic Short Pass Mirror, this mirror performs two functions.. One it transmits the light below 540nm in forward direction. Second, it reflects the light above 540nm at 90° angle.
Note: Above example explanation is for Dichroic SP Filter.
Detectors:
In flow cytometer, detectors commonly used are photo diodes and photo-multiplier tubes (PMTs). Most of the today's cytometers have PMTs installed in them. When emitted light travels through a set of filters and mirrors, they are directed to travel to the detectors. These detectors will capture the photo signal and convert them into electronic digital signal in the form of voltage pulse. These signals are then recorded. Light scattered in forward direction is collected by forward scatter detector (FSC) which measures the relative size of the cell, Light scattered to the side is collected by side scatter detector (SSC) which measures the relative granularity of the cell. and fluorescence light is collected by the fluorescence detectors which measure the mean and median fluorescent intensity of the emitted light. Relative height, area and width of the cell in a given heterogeneous population of cells can be measured.
Measurement of Forward and Side Scattered Light:
When cells or particles are passing through a laser beam, they scatter light in all directions, these scattered light are detected by the forward scatter (FSC) and side scatter (SSC) detectors. FSC measures the relative size of the cell, where as SSC measures the relative granularity of the cell. Based on this concept, cells or particles can be analyzed or separated based on their relative size and granularity.Example: a very good example for understanding the analysis of cells based on their size and granularity is analyzing blood cells which have different population of cells such as lymphocytes, granulocytes and monocytes.
When prepared blood sample is run in a flow cytometer, granulocytes produce larger population due to their high granularity and large size, so high fsc and high ssc. . Monocytes are large cells, but they are not so granular, they produce high fsc and low ssc. Lymphocytes also produce a separate population, due to their small size and low granularity, they produce low fsc and low ssc. In figure, you can see that, all these cells have produced different population based on their size and granularity.
 |
| Blood cells analyzed in flow cytometer. |
Measurement of Scattered light and Fluorescence Signal:
As explained above, cells can be analyzed and separated based on their size and granularity.. But, cells can also be analyzed and separated based on their expression or emission of fluorescence which is tagged to a particular protein. When a fluorescing cell is excited by a specific wavelength, they emit fluorescence in a specific wavelength. These emitted fluorescence is detected by specific fluorescence detectors. When cells scatter and emit the light wavelengths, they are allowed to pass through a set of specific filters, specific mirrors and specific detectors. The fluorescence signal is filtered so that each detector will detect the fluorescence at a specified wavelength range.
In this example above, the FITC PMT will detect light emitted from FITC molecules at ~520nm. where as the PE PMT will detect the light emitted from PE molecules at ~580nm. (Each PMT will also detect any fluorescence emitted which is in their own specified wavelength range).
As explained above, cells can be analyzed and separated based on their size and granularity.. But, cells can also be analyzed and separated based on their expression or emission of fluorescence which is tagged to a particular protein. When a fluorescing cell is excited by a specific wavelength, they emit fluorescence in a specific wavelength. These emitted fluorescence is detected by specific fluorescence detectors. When cells scatter and emit the light wavelengths, they are allowed to pass through a set of specific filters, specific mirrors and specific detectors. The fluorescence signal is filtered so that each detector will detect the fluorescence at a specified wavelength range.
 |
| Image Source: Abcam |
Measurement of Signal:
when a fluorescing cell passes through a laser beam, it creates a peak or pulse of a photon emission over time. These pulses are detected by the photo-multiplier tubes and converted to voltage pulse which is called as an 'Event". The total area and height of the pulse is measured by the flow cytometer. The voltage pulse area measured by the detectors correlate the relative fluorescence intensity of that cell.
when a fluorescing cell passes through a laser beam, it creates a peak or pulse of a photon emission over time. These pulses are detected by the photo-multiplier tubes and converted to voltage pulse which is called as an 'Event". The total area and height of the pulse is measured by the flow cytometer. The voltage pulse area measured by the detectors correlate the relative fluorescence intensity of that cell.
 |
| Image Source: Abcam A fluorescing cell creating a peak over time. |
 |
| Figure: Histogram plot showing low and high fluorescence intensity. Left: Low fluorescence intensity is measured (used as a control) Right: High fluorescence intensity is measured (sample under study) |
In the above histogram plot, cells which have low fluorescence or no fluorescence have produced lots of events at low fluorescence intensity,which is also called as "Auto-fluorescence". and cells which have high fluorescence have produced lots of events at high fluorescence intensity.
Flow Cytometry Data and Data Plots:
Flow cytometry data can be produced in the format of Dot Plot, Density Plot, Contour Plot and Histogram Plot. Histogram plots are used to measure the single fluorescence parameter, where as other plots can be used for the dual parameter analysis.. (For example: histogram plots will be fluorescence vs events, where as dot plots can be fluorescence-1 vs fluorescence-2, or SSC vs fluorescence). In cytometer data, each dot represents an event which could be cells or particles. The main task is find the proper dense population of cells which do not fall under the background or below threshold level. The lot of background in a flow cytometry data is due to the presence of lot of debris or dead cells in the sample tube. You can analyze by drawing a region around a population called gating and you can measure the fluorescence intensity for that population. The flow cytometry data also includes the statistics table, which includes the mean fluorescence and median fluorescence intensity of the fluorescing cell under study.
Here are the 4 main types of data plots.
 |
| Dot Plot |
 |
| Controur Plot |
 |
| Density Plot |
 |
| Histogram Plot |
Next Posts: Analysis of flow cytometry data, compensation, cell sorting (FACS)
Comments
Post a Comment