
Cell Cycle Demo and Protocol

Please Watch The Demo Video attached after the protocol and example Data!!!!

Preparation of Samples for Cell Cycle using Flow Cytometry

image.png

1) Suspend approximately million cells (10^6) in 1mL of 1x PBS (phosphate-buffered saline solution). and with the help of pipette, gently aspirate (up and down) about 7-8 times, to make the single cell suspension. 

2) Take a centrifuge tube and add 4mL of 70% ethanol.. (70% ethanol should be in ice before using). and add 1mL of cells in PBS to the same tube. Keep the tubes on ice for minimum 2 hours. This step is to fix the cells. (Cells can be kept at 4℃ for a week).


3) Centrifuge the ethanol fixed cells for 5 minutes at 300g. Carefully take out the supernatant. Do not disturb the pellet. 

4) Add 5mL of cold 1xPBS to this pellet and suspend the cells using pipette. 

5) Centrifuge the tubes at 300g for 5 minutes. Discard the supernatant. Again do not disturb the pellet. 

6) If required, step 5 can be repeated for one more time. 

7) Add 1mL of Propidium Iodide (PI) solution to the pellet and suspend the pellet using pipette. (PI concentration should be 50µg/mL. (Additionally you can add 100µg/mL RNase A before adding PI to degrade the RNA if present in the sample). 


8) Keep the tubes at room temperature for at least 30 minutes in the dark. (Note: You can keep the tubes at 37℃ for 10 minutes to speed up things). 

9) Trasnfer PI stained cells to flow cytometer tubes and run the samples on flow cytometer for the cell cycle analysis as soon as possible. (if there are clumps in the sample, vortex them or pipette them up and down until there are no clumps before running the samples tubes on flow cytometer).

10) For excitation of PI, 488nm or 561nm lasers can be used and emission at 620nm. 


Other Notes:

1) Be sure to use approximately equal number of cells in each tubes. better to count the cells before proceeding using hematocytometer. 

2) Try to get a good single cell suspension for better staining and better cell cycle analysis. 

3) Use proper and equal PI concentration for each sample tubes. 


Please Watch The Demo Video attached below on How You Can Analyze Cell Cycle in a Flow Cytometer and What to Gate and Consider


Image result for cell cycle data
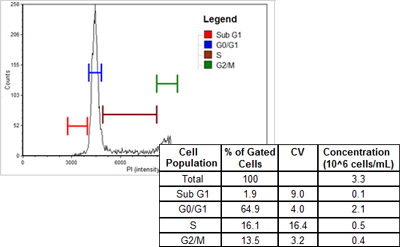
Source: Nexcelom Bioscience


Comments:


HTML


Comments

Popular posts from this blog

Nanodrop

Thermofisher, Nanodrop 1000    Nanodrop is a spectrophotometer which is designed to measure the concentration of nucleic acids at 260nm and Proteins at 280nm present in a very small minute volume. It is also capable of measuring the concentrations of dsDNA, RNA, ssRNA and purified protein. Required sample size is usually 1µL. Nanodrop instruments are usually full spectrum spectrophotometer, i.e., Ultra violet and visible range wavelengths (250nm to 750nm).  Nanodrop is commonly used for the quantification of the DNA concentration and RNA concentration in a given sample. However there are many other applications which can be performed on this instrument.  It works on the principle of Spectrophotometer or Sample Retention System....  Principle of Nanodrop: "The Nanodrop works on the principle of sample retention system.. When the small volume of sample is introduced, the arm and pedestal will work together and make the sample in the form of colum...

Statistics in Flow Cytometry Data and "MFI" values

                                 The speed of the flow cytometry offers wide range of data points and data plots. Due to its sensitivity and versatility, it has been used extensively. Flow cytometer can detect up to 1000s of cells per second.. But, it should be noted that the flow cytometry also involves the statistics, its significance, calculating the fluorescence intensity..                Statistics in flow cytometry involves, total number of data points acquired, percentage population, most importantly mean and median fluorescence intensity, and others. Most of us get confused about the term "MFI", whether it means mean fluorescence intensity or median fluorescence intensity.. Truth is, both.. It means it can be described as either mean or median fluorescence intensity. Some researchers use Mean for MFI and some use Median for MFI values.  (Keep...

Compensation in Flow Cytometry (Fluorescence Spill Over Correction).

                      The term "Compensation" in flow cytometers refers to the process of correcting fluorescence spill over. The compensation matrix ensures that the fluorescence emitted is detected in a particular detector which is from the fluorescence being measured. As we all know that most of the fluorescence molecules have broad emission range. if more than one one fluorescence is selected, their emission spectra may overlap. To correct this spectral overlap in cytometry data, a mathematical matrix called compensation is used. The Intention of this article is to teach you the compensation from basic theory to practical. This example for FITC and PE fluorescence molecules shows that, Some of the FITC fluorescence is being detected in PE Detector. and Some of the PE fluorescence is being detected in FITC Detectors. Task here is to make sure that in cytometry data, FITC is in FITC detector only and PE is in PE Detector only....